Why Improve Dispersion Rheology?
Improve Dispersion Rheology means controlling how particles move, interact, and remain distributed in a liquid. It is not merely a laboratory concern. Viscosity, yield stress, and thixotropic recovery affect pumping, storage, application, and final coating appearance. A batch may look smooth in a beaker yet sag on a vertical panel. Small details matter: the wetting agent, mixing energy, particle size, and order of addition can shift the result.
The commercial stakes are substantial. Grand View Research’s 2023 Paints and Coatings Market report estimated the global market at USD 179.98 billion, with projected annual growth of 4.3% from 2024 to 2030. Market size alone does not prove that better rheology drives growth, but it shows why repeatable processing matters across a broad industry. Measurement discipline matters, too. ISO 3219-1:2021 sets terminology and general principles for rotational and oscillatory rheometry. As Eugene C. Bingham’s widely cited definition puts it, “Rheology is the study of the flow and deformation of matter.” That idea is simple. Applying it to concentrated dispersions is not. Improve Dispersion Rheology by connecting controlled measurements with real production conditions, then checking whether the improvement survives scale-up. A higher viscosity reading is not automatically better. Even experienced formulators sometimes mistake a stable-looking sample for a robust process. That deserves scrutiny.
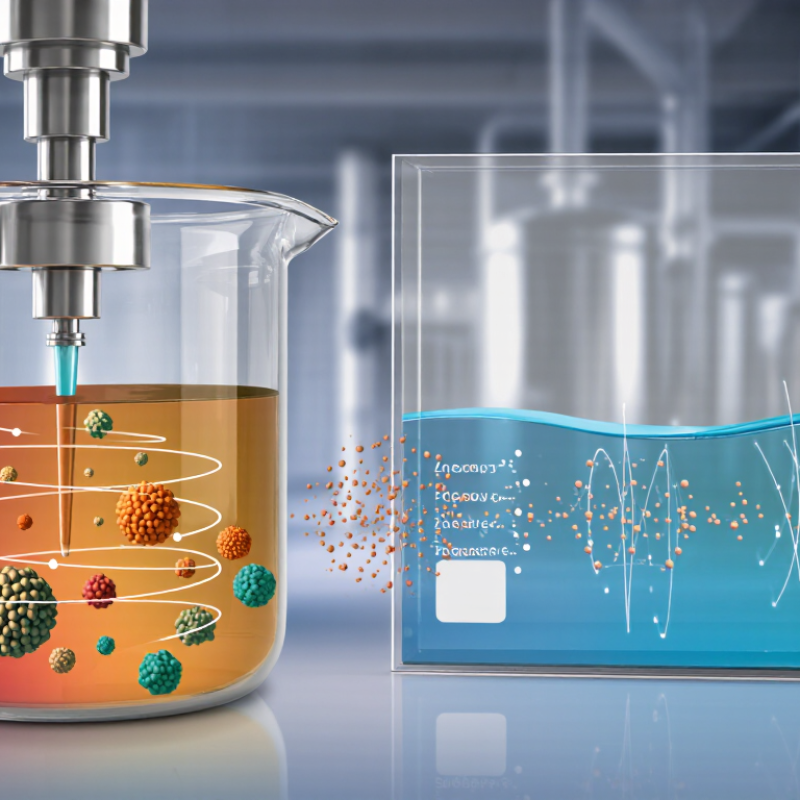
What Dispersion Rheology Measures
Why Improve Dispersion Rheology?
What Dispersion Rheology Measures
Dispersion rheology describes how a mixture flows and changes under force. It helps reveal how suspended particles interact with the liquid and with one another. A rheometer can measure viscosity as shear rate changes, such as when a sample is stirred, pumped, or spread.
The flow curve is useful. If viscosity falls as stirring speeds up, the material is shear-thinning. This can help explain why a coating spreads easily but rests without running. Some dispersions also resist movement until enough force is applied. That threshold is often described as yield stress. After stirring, a structure may rebuild over time; this recovery is associated with thixotropic behavior.
These measurements depend on test conditions. Temperature, mixing history, sample loading, and measurement geometry can all affect the result. A small air bubble or an unevenly mixed sample may distort the reading. One number can mislead. It is better to compare samples using the same procedure and examine the full flow curve, rather than relying on viscosity at one speed. Still, laboratory testing cannot reproduce every production line or storage condition. Results need practical checks against actual handling and use.
How Particle Interactions Control Flow and Stability
A dispersion’s flow depends not only on the carrier liquid but also on how particles interact. Strong attraction can form loose clusters that trap liquid and raise viscosity. Under shear, some clusters break apart, so a sample may pour easily yet thicken again at rest. Small changes matter. Surface charge, pH, dissolved salts, and particle size can all shift these interactions. A formulation that looks smooth in a beaker may still settle during storage.
Repulsive forces help keep particles apart, while a weak particle network can slow settling. Too much attraction, however, may create lumps, uneven coatings, or a sharp rise in mixing torque. Too much repulsion can reduce structure, allowing dense particles to sink. The useful balance depends on the process: pumping, spraying, casting, or storage. Measure viscosity across shear rates, then check how the material recovers after resting and inspect sediment over time. A single viscosity number rarely tells the whole story. Keep that in mind. Tests can miss real handling conditions; temperature and mixing history often matter. That limitation deserves attention, even when the measurements look precise.
What Causes Poor Dispersion Rheology
Why Improve Dispersion Rheology?
What Causes Poor Dispersion Rheology
Poor dispersion rheology often starts with particles that do not separate or wet evenly. Clumps can trap air and create rough, inconsistent flow. A sample may look smooth at first, then thicken after standing. That change matters during pumping, coating, or pouring. Particle size and surface chemistry also affect how particles interact. Small differences can shift viscosity more than expected.
Formulation and processing both play a part. Too little dispersant may leave particle surfaces partly uncovered; too much can sometimes destabilize the system. High solids loading leaves less room for particles to move. Mixing energy, temperature, and storage time can change the result, too. It is easy to blame the mixer, but that is not always fair. I would check wetting and ingredient compatibility before assuming more mixing will fix everything.
Tips: Compare samples at the same temperature and after the same resting time. Watch for settling, lumps, and changes in flow. Adjust one variable at a time, and record the result. Small tests help reveal what is actually driving the problem.
Why Improve Dispersion Rheology? What Causes Poor Dispersion?
Agglomerates behave like larger particles and can settle much faster. This chart shows idealized settling speeds calculated using Stokes’ law for spherical silica agglomerates in water at 20°C.
Model assumptions: silica density 2,650 kg/m³, water density 1,000 kg/m³, and water viscosity 1.0 mPa·s. These are theoretical estimates, not measurements of a specific formulation. Poor wetting, insufficient shear, unsuitable dispersant chemistry or dosage, and high solids loading can promote agglomeration.
How Improved Rheology Enhances Processing and Product Quality
Improving dispersion rheology is not simply about making a mixture thinner. It means shaping how a dispersion flows at rest and under shear, so it can be mixed, pumped, and applied reliably. A stable viscosity profile can reduce settling during storage while allowing smooth flow through a hose or coating gap. Operators may notice fewer pressure swings, less material clinging to tank walls, and more even film coverage. Small changes matter. Dispersant level, solids loading, and milling energy can shift yield stress and shear response. Results still depend on particle size and surface chemistry. There is no universal setting.
Better flow can also protect product quality. Evenly distributed particles help reduce hard sediment, streaks, and uneven color after application. Compare viscosity at several shear rates, then inspect a sample after it stands overnight. This can reveal behavior a single cup reading misses. A cleaner-looking batch can still hide weak storage stability. Excessive fluidity may encourage settling or splashing, while an overly structured blend can trap air and resist leveling. Temperature, mixing sequence, and pump design all affect the result. Lab success does not always carry over to production, so test adjustments under realistic process conditions.
Methods for Evaluating and Optimizing Dispersion Rheology
Why Improve Dispersion Rheology?
Methods for Evaluating and Optimizing Dispersion Rheology
A dispersion can look uniform in a beaker and still behave poorly during pumping, coating, or storage. Rheology testing helps reveal how particles and liquid move together under changing forces. Start by recording viscosity across a useful range of shear rates, rather than relying on one reading. That single number can hide important behavior.
Use a rotational rheometer or viscometer with controlled temperature and a consistent sample-preparation routine. Note the spindle or geometry, mixing time, rest period, and measurement sequence. Small differences matter. A flow curve can show whether the material thins under shear, while a recovery test can indicate how quickly structure returns after mixing. Watch for settling, air bubbles, and edge drying; each can distort results.
Optimization works best when one variable changes at a time. Adjust dispersant level, solids loading, mixing energy, or addition order, then repeat the same test. Compare flow curves and practical checks, such as sag on a vertical panel or settling in a clear cylinder. The data may still feel messy. That is useful information, not a reason to force a clean conclusion. If measurements vary between batches, review sample handling before changing the formulation.