
Top 10 Touch Screen Manufacturers for Global Buyers

Choosing a Touch Screen manufacturer is not just a matter of comparing prices. Global buyers must match the display to its real working environment. A kiosk in a bright station needs different performance from a medical monitor or a factory control panel. Sunlight readability, glove response, surface durability, and stable supply can all affect the final choice.

Steve Jobs, a prominent product-design leader, captured one important user expectation at the 2007 iPhone launch: “Who wants a stylus? You have to get ’em and put ’em away, and you lose ’em. Yuck. Nobody wants a stylus. So let’s not use a stylus.” His remark highlights the value of direct, intuitive interaction, though it does not mean every application can avoid a stylus. Details matter.

This guide introduces ten Touch Screen manufacturers for global buyers, with attention to technologies, customization, production capabilities, and support. It also considers practical questions: Can the supplier handle the required screen size? Are samples available for testing? How does the panel respond to water, dust, or repeated use? A product sheet may look convincing. Real-world testing can still reveal weaknesses. No ranking can replace a buyer’s own evaluation, and supplier information should be verified before a long-term commitment.
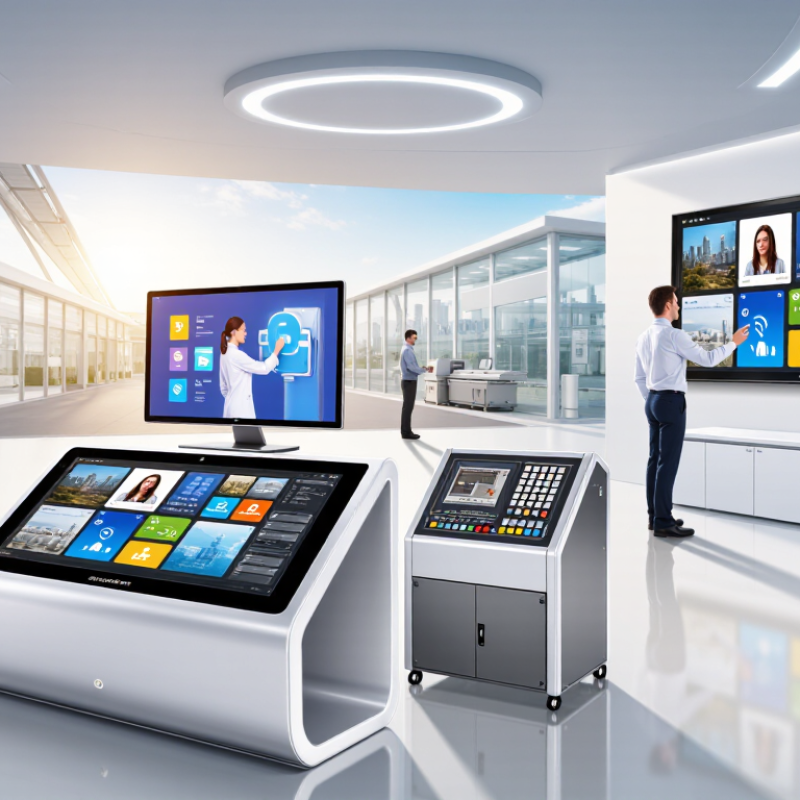
Top 10 Touch Screen Manufacturers for Global Buyers

Define Touchscreen Technologies: PCAP, Resistive, and 10-Point Multi-Touch

PCAP, or projected capacitive touch, detects changes in an electric field near the screen surface. It supports smooth gestures and can recognize several fingers at once. A glass cover is common, but thick gloves or moisture may affect response. Resistive screens register pressure between flexible layers. They can work with a gloved finger or a simple stylus, which helps in some industrial settings. Their surface may feel less glass-like, and image clarity can be lower. The difference is noticeable under bright lights.

“10-point multi-touch” describes how many simultaneous touch points a system can track, not a separate sensing technology. PCAP often supports this feature, but the controller, operating system, and application all matter. Ten reported points do not guarantee equal accuracy across the screen. Test the actual interface, especially near edges and with fast gestures. Specifications can look cleaner than real use; I have seen a technically capable panel feel awkward once a user wears work gloves.

Tips: Match the screen to the task. Try the intended gloves, stylus, and lighting before choosing. Check response time, surface durability, and touch performance at the edges. Ask for a sample unit. Small differences matter.

Set Sourcing Benchmarks: IEC 60529 IP Ratings and 1,000-Nit Brightness

IEC 60529 ratings give buyers a useful starting point for comparing touch displays, but the number must match the real installation. An IP65 enclosure is dust-tight and tested against water jets; IP67 covers temporary immersion under specified test conditions. These ratings do not automatically apply to every mounting method or cable entry. Ask for the test report and confirm that it covers the complete assembled unit, including seals, connectors, and any protective glass.

Check the intended exposure. A kiosk under a roof faces different risks from a panel beside a washdown area. Small details matter. A poorly compressed gasket can undermine an otherwise robust enclosure. I would verify installation instructions and replacement-seal requirements, not just the headline rating. Test evidence is more useful than a supplier’s broad claim.

A 1,000-nit display can improve readability in bright settings, but brightness alone does not guarantee clear viewing. Reflections, viewing angle, contrast, and optical bonding all affect what users see. Request measurements at the display surface and ask whether brightness is sustained at operating temperature. A unit may dim as it heats. That trade-off deserves scrutiny. If possible, assess a sample outdoors at the expected angle and time of day; indoor showroom lighting can hide glare problems.

Map 10 Global Manufacturers by Technology, Region, and Market Segment

A useful global map of ten touch-screen manufacturers starts with technology, not a ranking. Profiles 1–3 represent East Asian suppliers focused on projected-capacitive panels, cover-glass bonding, and high-volume consumer displays. Profile 4 reflects a Japanese engineering focus, where optical clarity and precise touch response may matter more than the lowest unit price. Profiles 5–6 represent European specialists serving industrial and medical equipment, often with reinforced glass, glove-touch support, or long product lifecycles. Profile 7 illustrates a North American supplier serving transportation and rugged-device projects. Profiles 8–10 represent manufacturers across South and Southeast Asia, where growing assembly capacity can suit regional sourcing and mid-volume orders. These are market profiles, not endorsements; actual capabilities differ by facility.

Segment fit changes the shortlist. A tablet maker may prioritize thin bonding and consistent multi-touch performance, while a factory-equipment buyer may need operation with gloves and stable response near electrical noise. Ask for samples. Test them under real lighting, with the intended enclosure and firmware. Request data on brightness, touch accuracy, operating temperature, and production traceability. Regional presence can simplify communication, but it does not guarantee shorter lead times. Fit varies. One limitation in any global map is that suppliers’ public specifications may not reflect the exact panel configuration offered for a project. Verify the sample, documentation, and quoted production site before comparing prices.

Top 10 Touch Screen Manufacturers for Global Buyers — Map 10 Global Manufacturers by Technology, Region, and Market Segment

An anonymized global market map for supplier screening. The profiles are regional supplier archetypes, not named companies or a ranked vendor list; capabilities and regional patterns are described at industry level.

Profile Regional Manufacturing Cluster Touch Technology and Integration Common Product Forms Typical Market Segments Buyer Evaluation Priorities
Profile 01 Mainland China Projected capacitive (PCAP) sensor and touch-module production; some suppliers offer cover-glass and display-module integration. Smartphone and tablet modules; industrial touch displays; custom-size panels. Consumer electronics, industrial HMI, retail, and selected automotive applications. Confirm production capacity, display compatibility, environmental testing, traceability, and long-term component availability.
Profile 02 Taiwan PCAP sensors and touch modules, including film- and glass-based constructions; integration services vary by supplier. Touch sensors, bonded touch-display assemblies, and embedded modules. Consumer devices, automotive displays, medical equipment, and industrial controls. Review controller compatibility, optical bonding options, customization capability, and qualification support.
Profile 03 South Korea Display-panel supply with integrated touch approaches such as on-cell or in-cell implementations on applicable products. Thin display assemblies for mobile devices and selected vehicle displays. Mobile electronics, premium displays, and automotive cockpit systems. Check whether touch is integrated into the panel, supported sizes and resolutions, interface requirements, and program availability.
Profile 04 Japan Display and touch solutions spanning PCAP and, in some product lines, resistive touch technologies. Compact displays, touch panels, and industrial-grade display assemblies. Factory automation, instrumentation, transportation, medical equipment, and automotive systems. Assess operating-temperature range, lifecycle commitments, reliability data, and availability of technical documentation.
Profile 05 North America Industrial touch systems commonly use PCAP; optical and infrared touch technologies are also used in large-format applications. Rugged monitors, open-frame displays, kiosks, and large-format touch systems. Healthcare, public-sector installations, retail, transportation, and industrial automation. Evaluate system-level integration, service coverage, operating environment, accessibility requirements, and repair options.
Profile 06 Europe Industrial PCAP and resistive touch solutions, often configured for integration into human-machine interfaces. Panel-mount displays, control terminals, and custom HMI assemblies. Factory automation, process control, energy, transport, and medical equipment. Verify applicable regulatory documentation, ingress-protection options, glove operation, lifecycle support, and local service arrangements.
Profile 07 China–Taiwan supply network PCAP touch modules paired with LCD panels; optical bonding and cover-lens customization may be available through the supply chain. Standard-size and custom touch-display modules for embedded products. Point of sale, smart-home devices, industrial controls, and information terminals. Clarify which supplier is responsible for the sensor, display, bonding, firmware, and final module qualification.
Profile 08 South and Southeast Asia Touch-display integration and module assembly; PCAP is common in contemporary interfaces, while resistive options remain available for specific designs. Embedded display modules, terminals, and locally configured assemblies. Retail, payment terminals, transportation, education, and industrial applications. Confirm the origin of critical components, manufacturing process controls, test coverage, and export documentation.
Profile 09 Multi-region industrial supplier base Infrared touch frames detect touch through interruption of an optical grid; the technology can support large display surfaces. Large-format interactive displays, kiosks, and retrofit touch frames. Education, digital signage, public information, and collaborative workspaces. Check ambient-light performance, bezel design, installation tolerances, calibration, and suitability for the deployment environment.
Profile 10 Multi-region specialist supplier base Surface acoustic wave (SAW) touch panels use acoustic waves across a glass surface; suitability depends on the operating environment. Specialist touch monitors and selected kiosk or control-panel designs. Indoor kiosks, public terminals, and certain commercial or industrial interfaces. Assess resistance to water, dust, and surface contamination; compare the technology with PCAP or resistive options for the use case.

Technology note: PCAP supports multi-touch and is widely used in modern touch interfaces. Resistive touch can be useful where stylus input or certain glove-use conditions are required. Infrared and SAW are distinct sensing methods, and their suitability depends on screen size and environmental conditions. Validate specifications, certifications, and supply terms directly with prospective suppliers.

Compare Supplier Specifications: Touch Accuracy, Interfaces, and Operating Range

A useful touchscreen comparison starts with the measurement method, not a supplier’s headline accuracy figure. Ask whether accuracy is stated in millimeters, across the full active area, and after calibration. A finger may work well at the center but miss a small icon near a corner. Request test results for bare fingers, gloves, moisture, and repeated touches. These conditions can change performance. Small differences matter.

Interfaces shape installation effort. USB HID can simplify host integration, while I²C or UART may suit embedded designs; confirm controller support, cable limits, and driver requirements. Compare the complete operating range, including the touch panel, controller, and display—not just one component. IEC 60068 environmental test methods help buyers specify cold and dry-heat testing. For electrical robustness, IEC 61000-4-2:2008 defines test levels up to 8 kV for contact discharge and 15 kV for air discharge. These are test levels, not guarantees of field performance. Ask suppliers for test conditions, pass criteria, and traceable reports. A specification sheet can still omit the awkward detail: performance after prolonged use. That gap deserves scrutiny.

Top 10 Touch Screen Manufacturers for Global Buyers — Supplier Specification Comparison

Representative technology profiles are shown instead of company or brand data. The chart compares approximate touch accuracy; interface options and operating temperatures vary by controller, panel construction, and product configuration.

How to read: Lower accuracy error in millimeters indicates more precise touch input. Common controller interfaces include USB HID, I²C, and SPI. Operating ranges are product-specific: standard indoor products often target about 0–50°C, while industrial versions may be specified for wider ranges such as −20–70°C. Treat these values as reference points, not guaranteed supplier specifications; confirm the test method and datasheet for each product.

Evaluate Compliance, Lead Times, and Total Cost of Ownership

For global buyers comparing touch screen manufacturers, compliance should be checked against the exact product and destination market. Request current test reports, material declarations, and traceable records for the finished assembly—not just a supplier’s general certificate. Confirm that the report covers the panel, touch controller, cables, and any coatings you will actually receive. A mismatch can delay approval after samples look perfect. Small gaps matter.

Lead times need the same scrutiny. Ask for separate figures for sample builds, production, inspection, and freight, plus the assumptions behind each date. The World Bank’s 2023 Logistics Performance Index used shipment-tracking data across 139 economies and highlighted how long goods can spend moving from exporter to importer. A factory’s quoted production time is only one slice of the calendar. Request evidence of component availability and a contingency plan for a delayed glass or controller shipment.

Total cost of ownership includes more than the unit price: tooling, yield loss, packaging, duties, rework, and field replacements all count. McKinsey’s 2020 global value-chain analysis reported that 93% of surveyed supply-chain leaders planned to make their networks more resilient. That shift may add upfront cost, but a second-source option or realistic buffer can protect launch schedules. Cheap is not cheap. Still, buffers can become waste if forecasts are poor; check the numbers quarterly.

Go to Top